Contract intelligence
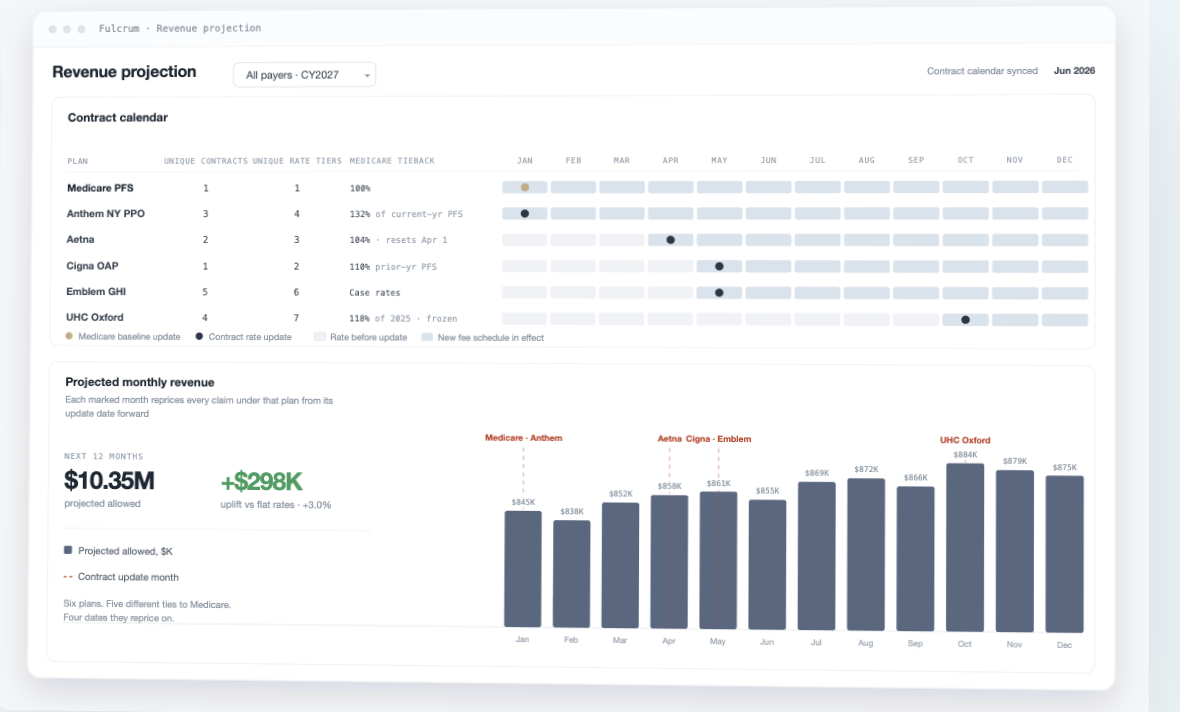
Structure payer products, fee schedules, Medicare tiebacks, and effective dates in one usable model.
 Contact us
Practice financial intelligence
See how every contract, payment, and service line performs. Connect visits, imaging, diagnostics, monitoring, and interventions to one payer-performance model.
Financial visibility for Cardiology
Fulcrum maps the reimbursement logic behind your cardiology service mix, then shows where payment, rate changes, and unit economics differ by payer product.
One connected intelligence layer
Structure payer products, fee schedules, Medicare tiebacks, and effective dates in one usable model.
Detect and investigate potential underpayments in an automated, accurate way.
Test proposed rates against actual volume and bring clear evidence into payer conversations.
Integrate encounter and cost data to see precise unit economics for specific CPT codes.
What becomes answerable
CY 2027 proposed PFS
A national specialty average is useful context, not a practice forecast. Your result depends on your codes, volume, locality, sites of service, and Medicare-linked contracts.
CMS's own reconciliation table (Table D-B5) puts cardiology at +1.5% for 2027. That figure is the specialty-wide, volume-weighted change in total RVU-based allowed charges: the aggregate gain or loss across every code the specialty bills, before the separate conversion-factor cut. Our reconstruction agrees closely at +1.2%, a net gain of $64 million in national allowed charges.
Cardiology bills about 67% of its Medicare dollars in the office (non-facility) setting. By site of service, the 2027 change splits as follows:
| Site of service | Change | Allowed $ |
|---|---|---|
| Office (non-facility) | +2.0% | +$69M |
| Facility | -0.3% | -$5M |
All figures are national, hold 2025 utilization fixed, and exclude the separate 1.68% conversion-factor cut that lands on every specialty on top of this.
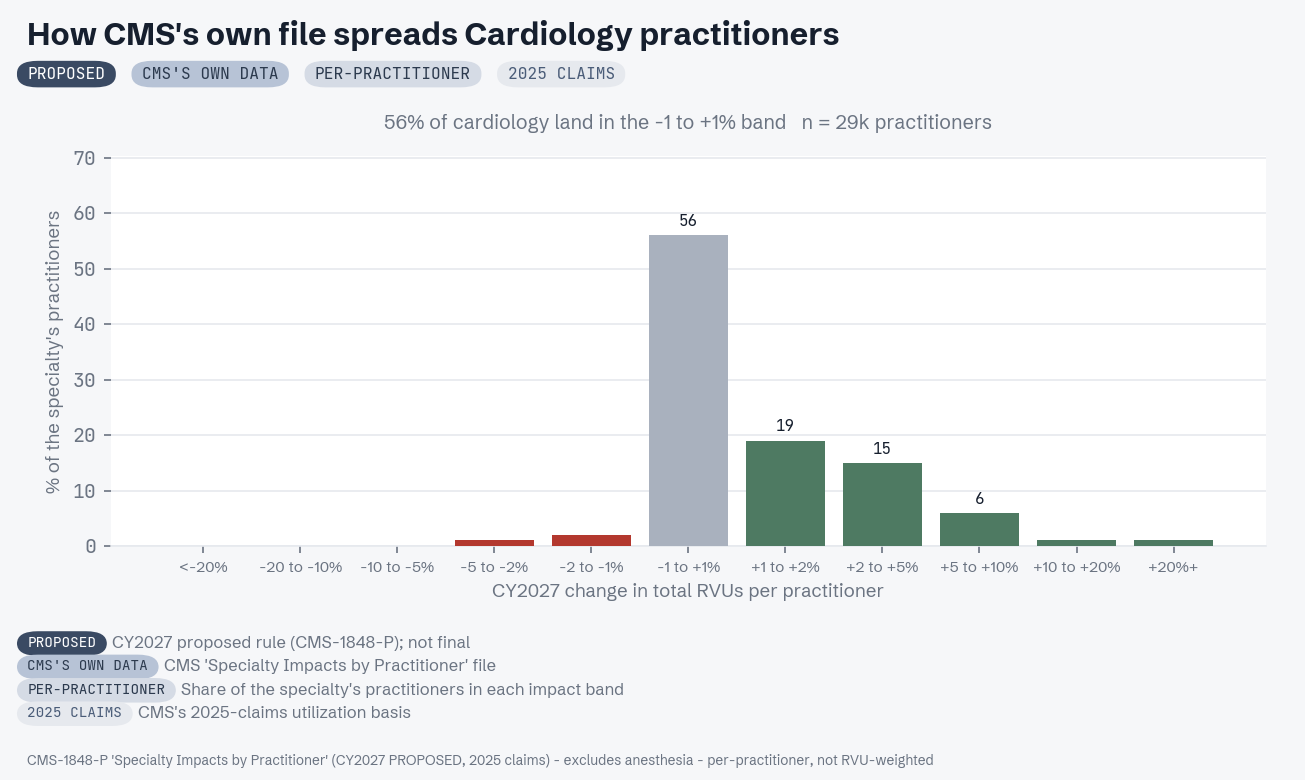
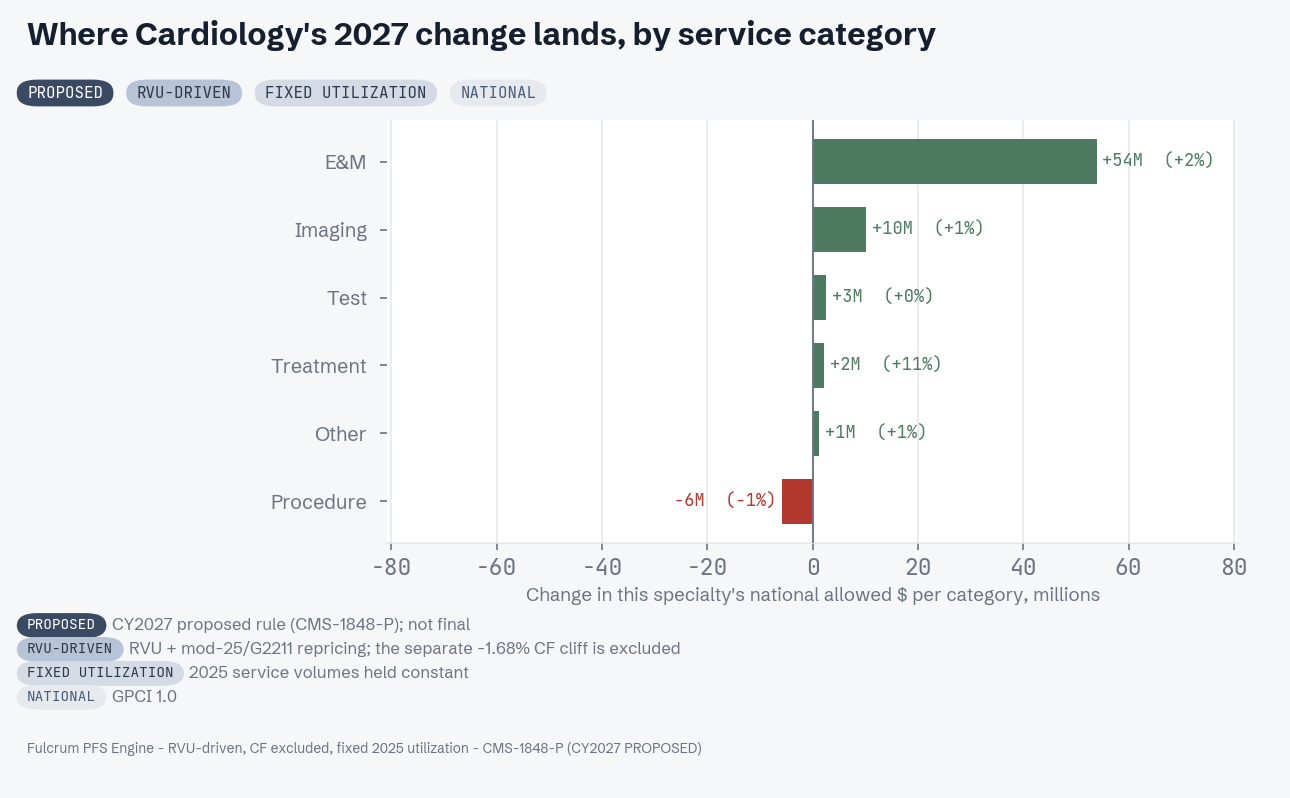
The specialty average hides a wide spread, and CMS's own practitioner-level file proves it. 56% of cardiology practitioners land in the -1 to +1% band, and about 23% see an increase above 2%. Where a practice lands is a question of service mix: the cardiology practices that gain the most are those with the most in-office imaging and testing; the visit-heavy practices come out slightly ahead.
Practice-specific analysis
Start with one contract, one fee-schedule question, or an ongoing view across the practice.